1.前置
1.1本地虚拟机
[root@HouYaxiong ~]# systemctl stop firewalld && systemctl disable firewalld
1.2云服务器
如果是云服务器则分别开启9200、5601端口
2.编辑系统配置文件
注意:
cat >> /etc/security/limits.conf << EOF
......
EOF
是一个整体,复制的时候要格外的注意。
单击左键查看cat的实用技巧 cat >>/etc/profile<<EOF
如果不习惯这种写法,可以换回vi或vim编辑器。
就如上面那个例子vi编辑器的用法如下:
# 1.先vi cat >> /etc/security/limits.conf << EOF 中间的 /etc/security/limits.conf 。
vi /etc/security/limits.conf
# 2.再将 << EOF......EOF 中间的内容复制粘贴进去。
2.1系统配置1
[root@HouYaxiong ~]# cat >> /etc/security/limits.conf << EOF
* soft nofile 65536
* hard nofile 131072
* soft nproc 2048
* hard nproc 4096
EOF
2.2系统配置2
[root@HouYaxiong ~]# cat >> /etc/sysctl.conf << EOF
vm.max_map_count=655360
EOF
[root@HouYaxiong ~]# cd /etc && sysctl -p
3.安装JDK1.8
3.1下载安装包
[root@HouYaxiong etc]# mkdir -p /data/soft/java && cd /data/soft/java && wget https://houxiongxiong-1310114553.cos.ap-chengdu.myqcloud.com/jdk/jre-8u361-linux-x64.tar.gz
3.2解压
[root@HouYaxiong java]# tar -zxvf jre-8u361-linux-x64.tar.gz && rm -f jre-8u361-linux-x64.tar.gz
3.3配置环境变量
[root@HouYaxiong java]# cat >> /etc/profile << EOF
export JAVA_HOME=/data/soft/java/jre1.8.0_361
export PATH=$PATH:$JAVA_HOME/bin
EOF
3.4生效环境变量
[root@HouYaxiong java]# source /etc/profile
3.5查看Java版本
如果版本为1.8.0_181则配置成功
[root@HouYaxiong java]# java -version
openjdk version "1.8.0_181"
OpenJDK Runtime Environment (build 1.8.0_181-b13)
OpenJDK 64-Bit Server VM (build 25.181-b13, mixed mode)
4.安装ElasticSearch数据库
4.1下载并解压安装包
[root@HouYaxiong java]# cd .. && wget https://houxiongxiong-1310114553.cos.ap-chengdu.myqcloud.com/tar/elasticsearch-6.4.3.tar.gz
[root@HouYaxiong soft]# tar -zxvf elasticsearch-6.4.3.tar.gz && rm -f elasticsearch-6.4.3.tar.gz
4.2修改配置文件
[root@HouYaxiong soft]# cd elasticsearch-6.4.3
[root@HouYaxiong elasticsearch-6.4.3]# cat >> ./config/elasticsearch.yml << EOF
# 开放端口
# 这是当前linux ip地址,ES节点, 暴露ES RESTful 接口端口号提供给外部通讯使用
network.host: 192.168.91.7
# 访问端口号(HTTP协议外部通信)
http.port:9200
EOF
5.用户管理
5.1创建用户
[root@HouYaxiong elasticsearch-6.4.3]# useradd zhangsan
5.2修改密码
密码尽量不要纯数字。
[root@HouYaxiong elasticsearch-6.4.3]# passwd zhangsan
更改用户 zhangsan 的密码 。
新的 密码:
重新输入新的 密码:
passwd:所有的身份验证令牌已经成功更新。
[root@HouYaxiong elasticsearch-6.4.3]#
5.3切换用户
[root@HouYaxiong elasticsearch-6.4.3]# su zhangsan
6.启动ElasticSearch数据库
6.1进入bin目录
[zhangsan@HouYaxiong elasticsearch-6.4.3]$ cd bin
6.2启动
[zhangsan@HouYaxiong bin]$ ./elasticsearch
执行过程大致如下
[2023-04-25T01:25:18,474][INFO ][o.e.n.Node               ] [] initializing ...
[2023-04-25T01:25:18,513][INFO ][o.e.e.NodeEnvironment    ] [RzZq2HN] using [1] data paths, mounts [[/ (rootfs)]], net usable_space [12.3gb], net total_space [16.9gb], types [rootfs]
[2023-04-25T01:25:18,513][INFO ][o.e.e.NodeEnvironment    ] [RzZq2HN] heap size [1007.3mb], compressed ordinary object pointers [true]
[2023-04-25T01:25:18,514][INFO ][o.e.n.Node               ] [RzZq2HN] node name derived from node ID [RzZq2HNzRciAk8Xdin5sZg]; set [node.name] to override
......
......
......
[2023-04-25T01:27:48,423][INFO ][o.e.c.s.MasterService    ] [RzZq2HN] zen-disco-elected-as-master ([0] nodes joined)[, ], reason: new_master {RzZq2HN}{RzZq2HNzRciAk8Xdin5sZg}{bQBLXuG7RY67t5jr1U7FBw}{192.168.138.35}{192.168.138.35:9300}{ml.machine_memory=3954188288, xpack.installed=true, ml.max_open_jobs=20, ml.enabled=true}
[2023-04-25T01:27:48,427][INFO ][o.e.c.s.ClusterApplierService] [RzZq2HN] new_master {RzZq2HN}{RzZq2HNzRciAk8Xdin5sZg}{bQBLXuG7RY67t5jr1U7FBw}{192.168.138.35}{192.168.138.35:9300}{ml.machine_memory=3954188288, xpack.installed=true, ml.max_open_jobs=20, ml.enabled=true}, reason: apply cluster state (from master [master {RzZq2HN}{RzZq2HNzRciAk8Xdin5sZg}{bQBLXuG7RY67t5jr1U7FBw}{192.168.138.35}{192.168.138.35:9300}{ml.machine_memory=3954188288, xpack.installed=true, ml.max_open_jobs=20, ml.enabled=true} committed version [1] source [zen-disco-elected-as-master ([0] nodes joined)[, ]]])
[2023-04-25T01:27:48,449][INFO ][o.e.x.s.t.n.SecurityNetty4HttpServerTransport] [RzZq2HN] publish_address {192.168.138.35:9200}, bound_addresses {192.168.138.35:9200}
[2023-04-25T01:27:48,450][INFO ][o.e.n.Node               ] [RzZq2HN] started
[2023-04-25T01:27:48,585][WARN ][o.e.x.s.a.s.m.NativeRoleMappingStore] [RzZq2HN] Failed to clear cache for realms [[]]
[2023-04-25T01:27:48,609][INFO ][o.e.l.LicenseService     ] [RzZq2HN] license [130043f0-8be9-4849-9325-fb9e344a0310] mode [basic] - valid
[2023-04-25T01:27:48,616][INFO ][o.e.g.GatewayService     ] [RzZq2HN] recovered [0] indices into cluster_state
如果卡在像上面第14行的那个结果的话那就“应该”就对了。
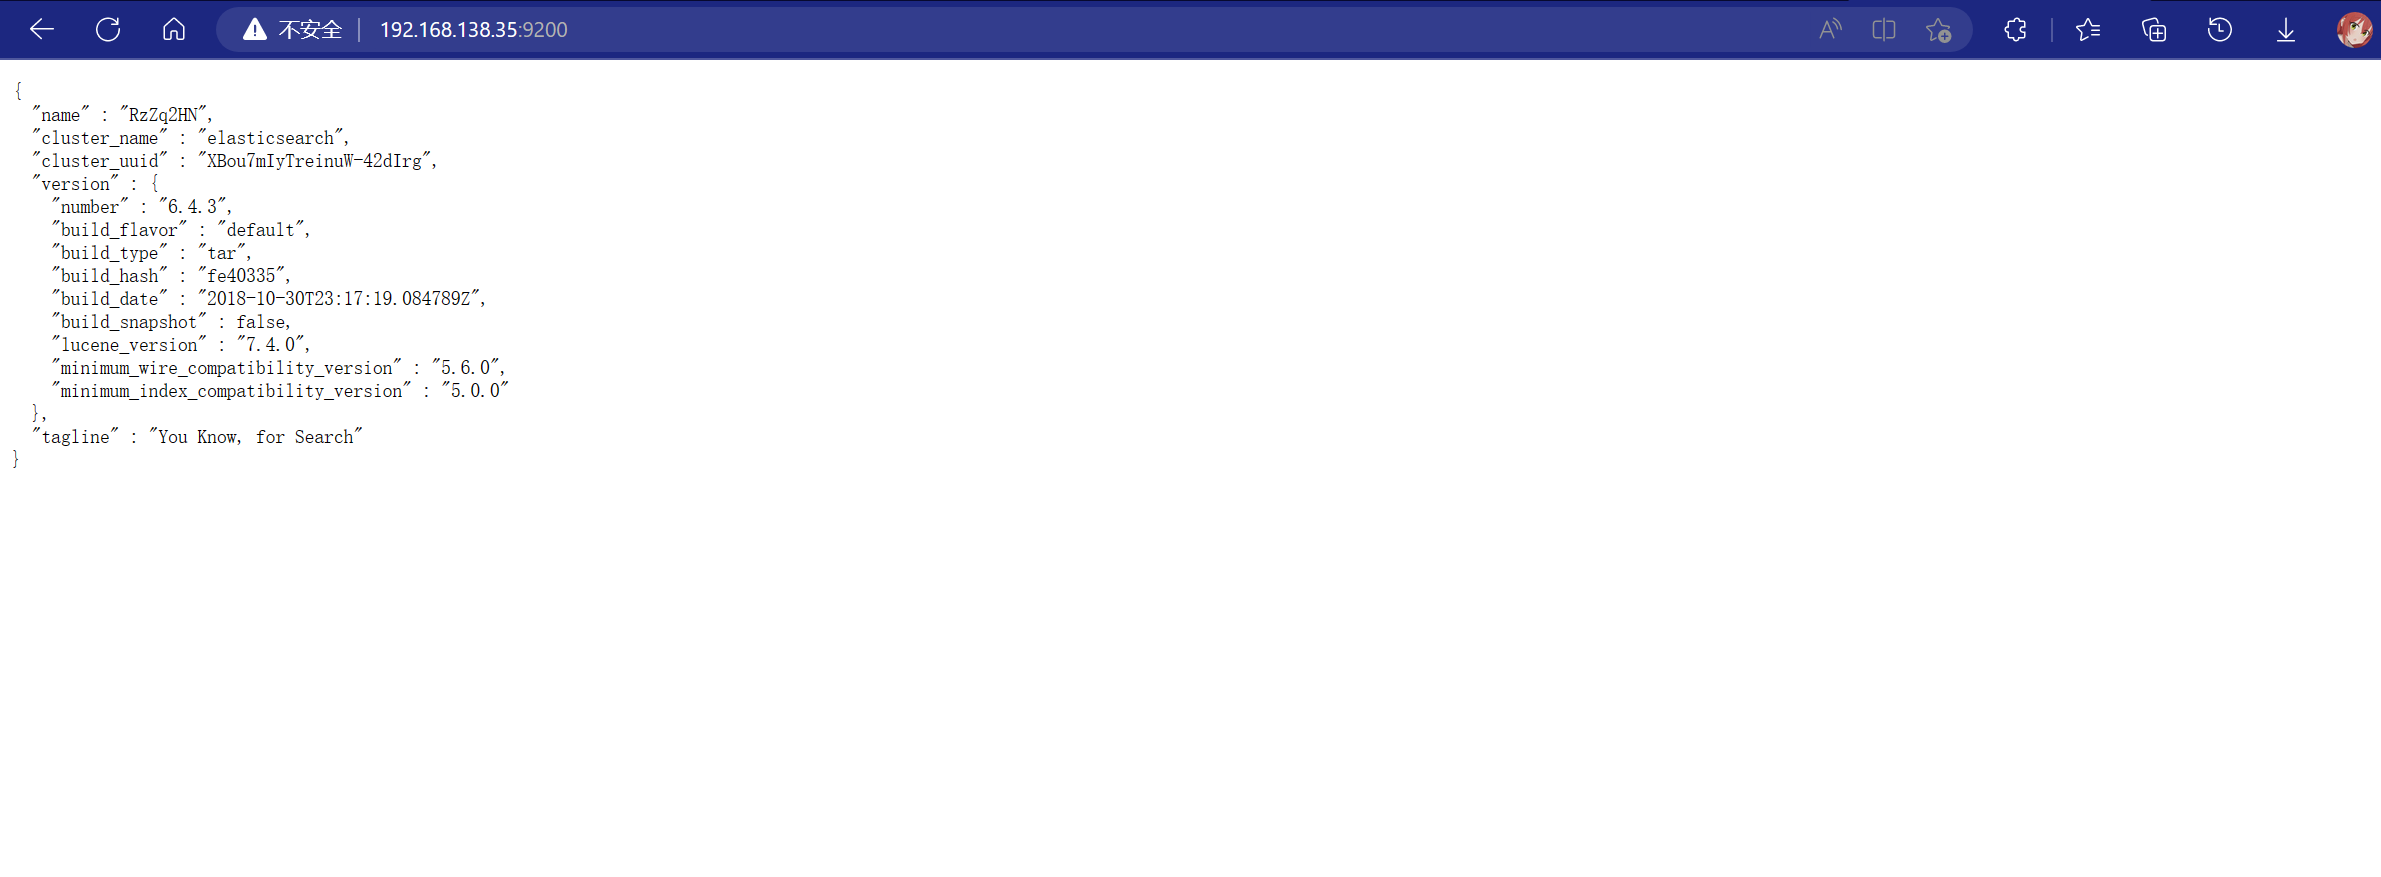
在浏览器输入:"虚拟机IP地址:9200"或"云服务器公网IP地址:9200",然后回车访问。
结果如下图所示那就是成功了。
7.安装可视化工具
7.1切换为root用户
因为上面ElasticSearch数据库启动的缘故可能会无法输入新的交互命令,所以建议新开窗口来执行下面的命令。
[zhangsan@HouYaxiong ~]$ su root
密码:
[root@HouYaxiong ~]#
7.2下载安装包
[root@HouYaxiong ~]# cd /data/soft && wget https://houxiongxiong-1310114553.cos.ap-chengdu.myqcloud.com/ELK/kibana-6.4.3-linux-x86_64.tar.gz
7.3解压
[root@HouYaxiong soft]# tar -zxvf kibana-6.4.3-linux-x86_64.tar.gz && rm -f kibana-6.4.3-linux-x86_64.tar.gz
8.启动可视化工具
8.1修改配置文件
[root@HouYaxiong soft]# cd kibana-6.4.3-linux-x86_64
[root@HouYaxiong kibana-6.4.3-linux-x86_64]# cat >> kibana-6.4.3-linux-x86_64/config << EOF
# kibana 监听端口
server.port: 5601
# 改为监听所有地址
server.host: "0.0.0.0"
# 你指定的es节点,连接kibana的url
elasticsearch.url: "http://虚拟机IP或云服务器IP:9200"
EOF
8.2启动
[root@HouYaxiong soft]# cd bin && ./kibana
执行过程大致如下
log   [18:49:30.484] [info][status][plugin:kibana@6.4.3] Status changed from uninitialized to green - Ready
  log   [18:49:30.505] [info][status][plugin:elasticsearch@6.4.3] Status changed from uninitialized to yellow - Waiting for Elasticsearch
  log   [18:49:30.507] [info][status][plugin:xpack_main@6.4.3] Status changed from uninitialized to yellow - Waiting for Elasticsearch
 ......
 ......
 ......
  log   [18:49:31.582] [info][status][plugin:logstash@6.4.3] Status changed from yellow to green - Ready
  log   [18:49:31.582] [info][status][plugin:reporting@6.4.3] Status changed from yellow to green - Ready
  log   [18:49:31.582] [info][kibana-monitoring][monitoring-ui] Starting monitoring stats collection
  log   [18:49:31.584] [info][status][plugin:security@6.4.3] Status changed from yellow to green - Ready
  log   [18:49:31.750] [info][license][xpack] Imported license information from Elasticsearch for the [monitoring] cluster: mode: basic | status: active
  log   [18:49:38.466] [info][listening][server][http] Server running at http://0.0.0.0:5601
如果卡在像上面第12行的那个结果的话那就“应该”就对了。
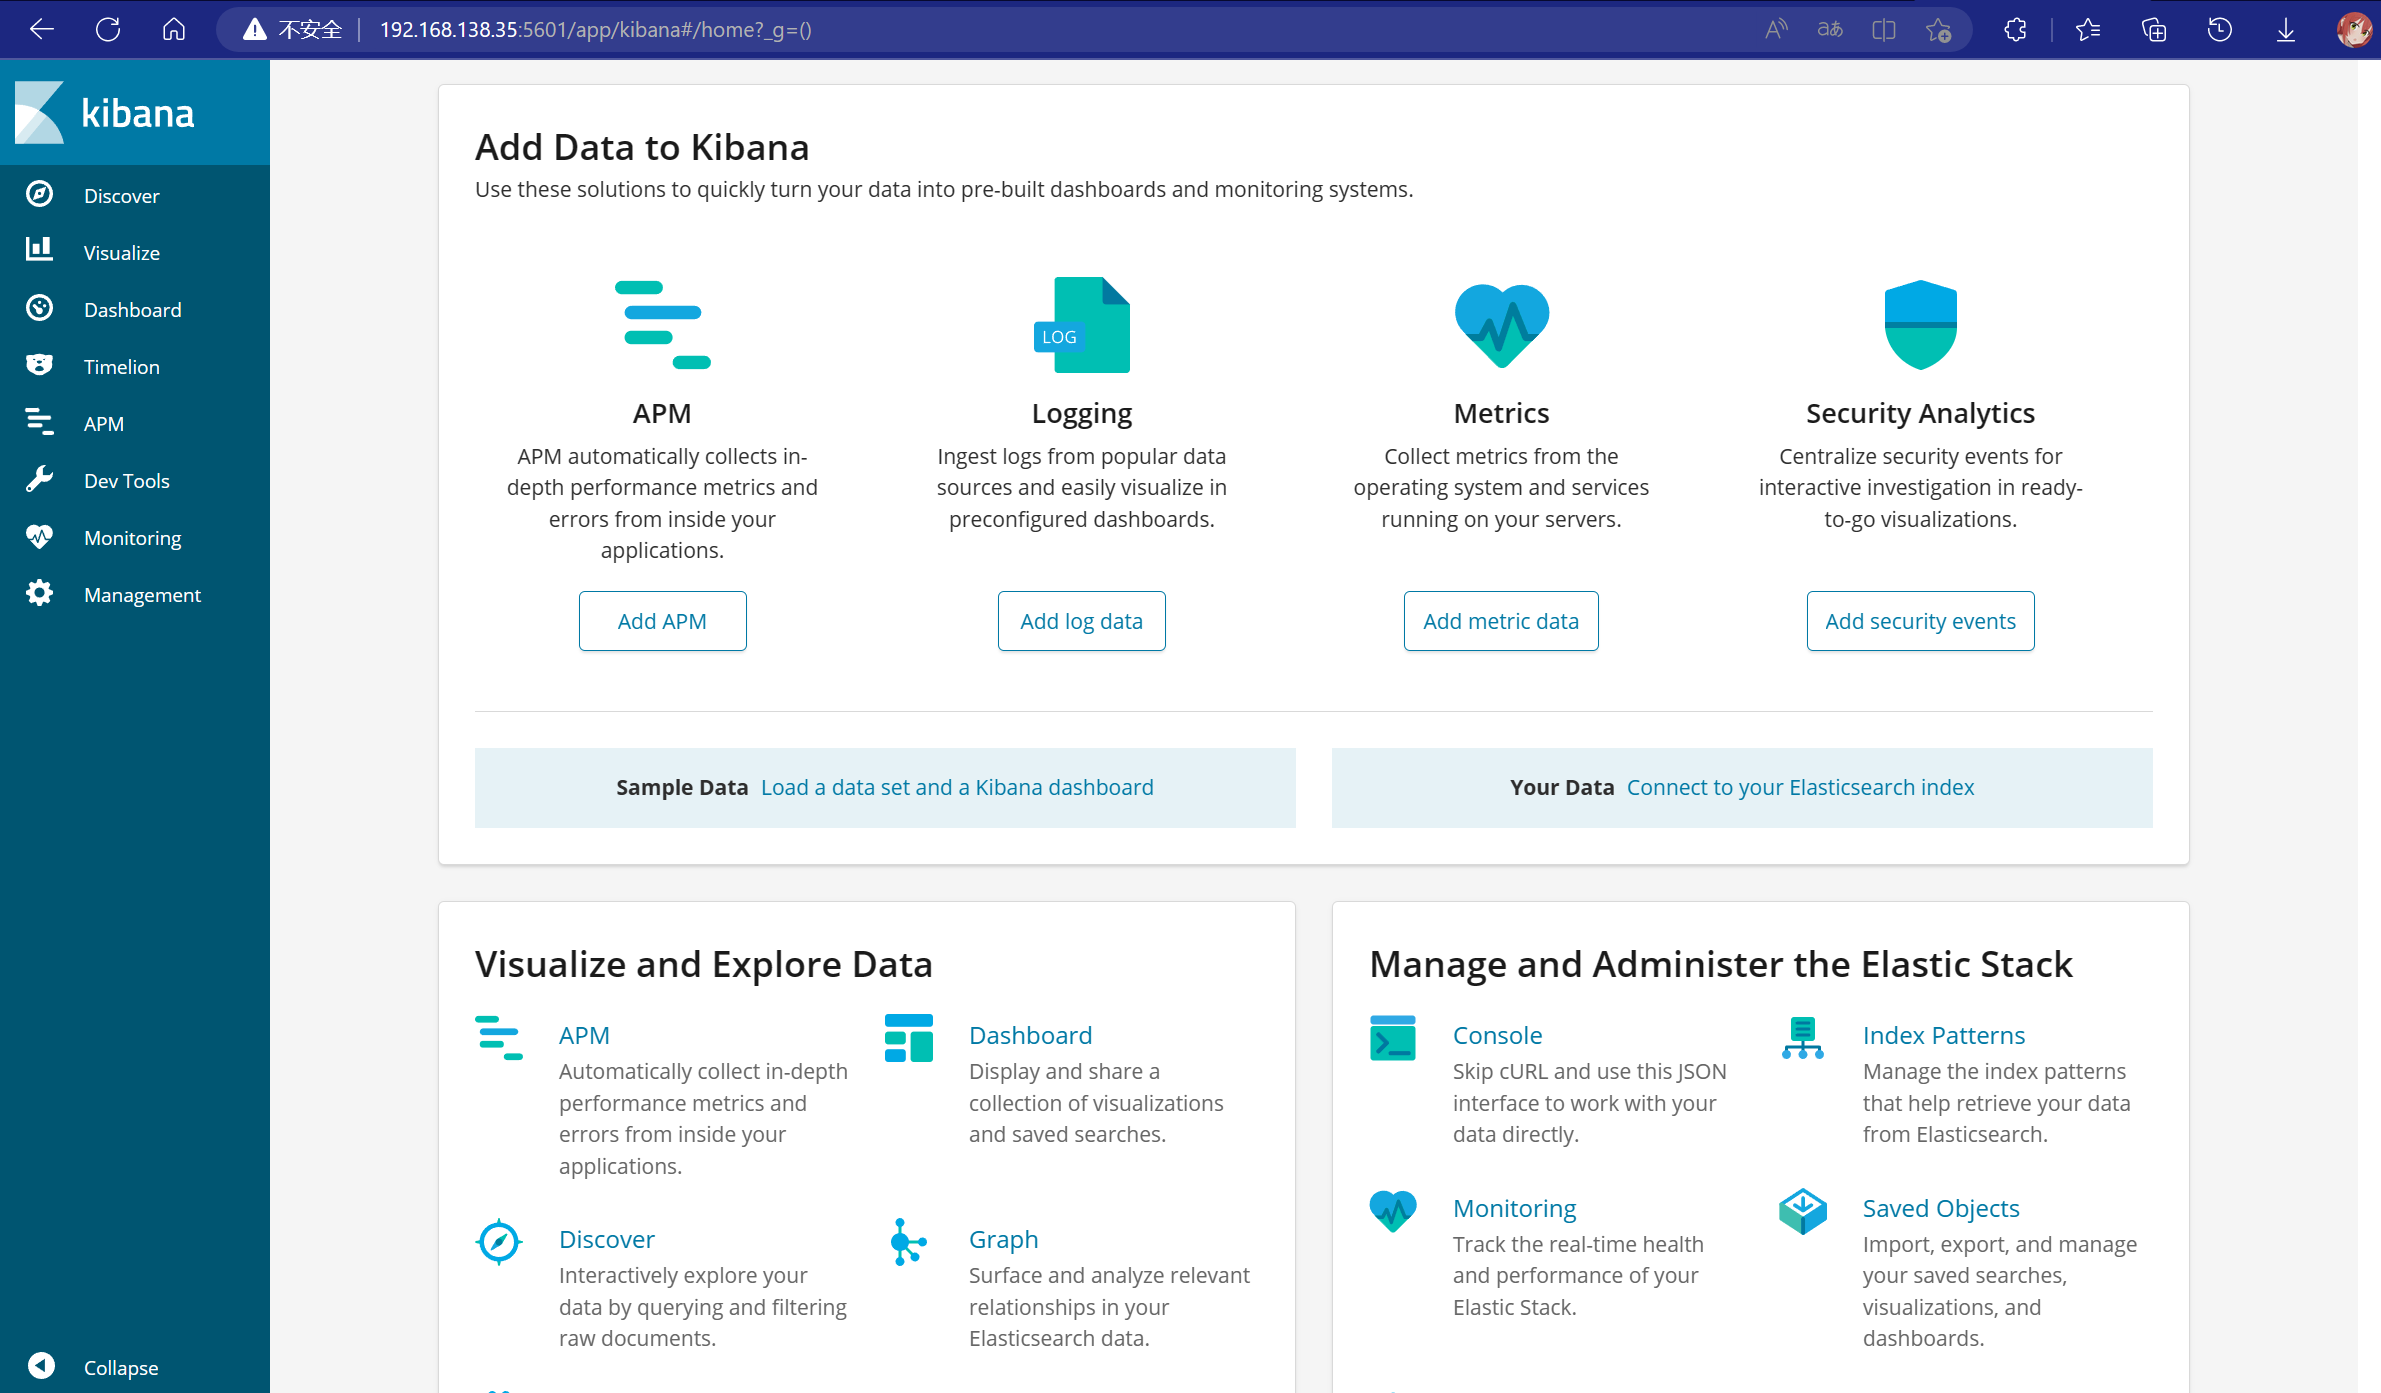
在浏览器输入:"虚拟机IP地址:9200"或"云服务器公网IP地址:5601",然后回车访问。
结果如下图所示那就是成功了。
9.安装logstash
9.1下载安装包
因为上面可视化工具启动的缘故可能会无法输入新的交互命令,所以建议新开窗口来执行下面的命令。
[root@HouYaxiong ~]# cd /data/soft && wget https://houxiongxiong-1310114553.cos.ap-chengdu.myqcloud.com/ELK/logstash-6.4.3.tar.gz
9.2解压
[root@HouYaxiong soft]# tar -zxvf logstash-6.4.3.tar.gz && rm -f logstash-6.4.3.tar.gz
9.3编写配置文件
[root@HouYaxiong soft]# cd logstash-6.4.3
[root@HouYaxiong logstash-6.4.3]# cat >> config/logstash.conf << EOF
input {
	beats {
		port => 5044
	}
	file {
        path => "/var/log/messages"
        type => "systemlog"
        start_position => "beginning"
        stat_interval => "3"
	}
    file {
        path => "/var/log/secure"
        type => "securelog"
        start_position => "beginning"
        stat_interval => "3"
    }
}
output {
    elasticsearch {
        hosts => ["http://10.6.200.117:9200"]
        index => "%{[@metadata][beat]}-%{[@metadata][version]}-%{+YYYY.MM.dd}"
	}
    if [type] == "systemlog" {
        elasticsearch {
            hosts => ["10.6.200.117:9200"]
            index => "system-log-%{+YYYY.MM.dd}"
        }
    }
    if [type] == "securelog" {
        elasticsearch {
            hosts => ["10.6.200.117:9200"]
            index => "secure-log-%{+YYYY.MM.dd}"
        }
    }
}
EOF
9.4启动
[root@HouYaxiong logstash-6.4.3]# ./bin/logstash -f config/logstash.conf
执行过程大致如下
Sending Logstash logs to /data/soft/logstash-6.4.3/logs which is now configured via log4j2.properties
[2023-04-25T03:22:17,339][INFO ][logstash.setting.writabledirectory] Creating directory {:setting=>"path.queue", :path=>"/data/soft/logstash-6.4.3/data/queue"}
[2023-04-25T03:22:17,344][INFO ][logstash.setting.writabledirectory] Creating directory {:setting=>"path.dead_letter_queue", :path=>"/data/soft/logstash-6.4.3/data/dead_letter_queue"}
......
......
......
[2023-04-25T03:22:20,721][INFO ][org.logstash.beats.Server] Starting server on port: 5044
[2023-04-25T03:22:20,767][INFO ][filewatch.observingtail  ] START, creating Discoverer, Watch with file and sincedb collections
[2023-04-25T03:22:20,778][INFO ][filewatch.observingtail  ] START, creating Discoverer, Watch with file and sincedb collections
[2023-04-25T03:22:20,790][INFO ][logstash.agent           ] Pipelines running {:count=>1, :running_pipelines=>[:main], :non_running_pipelines=>[]}
[2023-04-25T03:22:21,126][INFO ][logstash.agent           ] Successfully started Logstash API endpoint {:port=>9600}
如果卡在像上面第11行的那个结果的话那就“应该”就对了。
然后,回到“可视化工具WEB端”。
不知道的话可以在浏览器输入:"虚拟机IP地址:5601"或"云服务器公网IP地址:5601",然后回车访问。
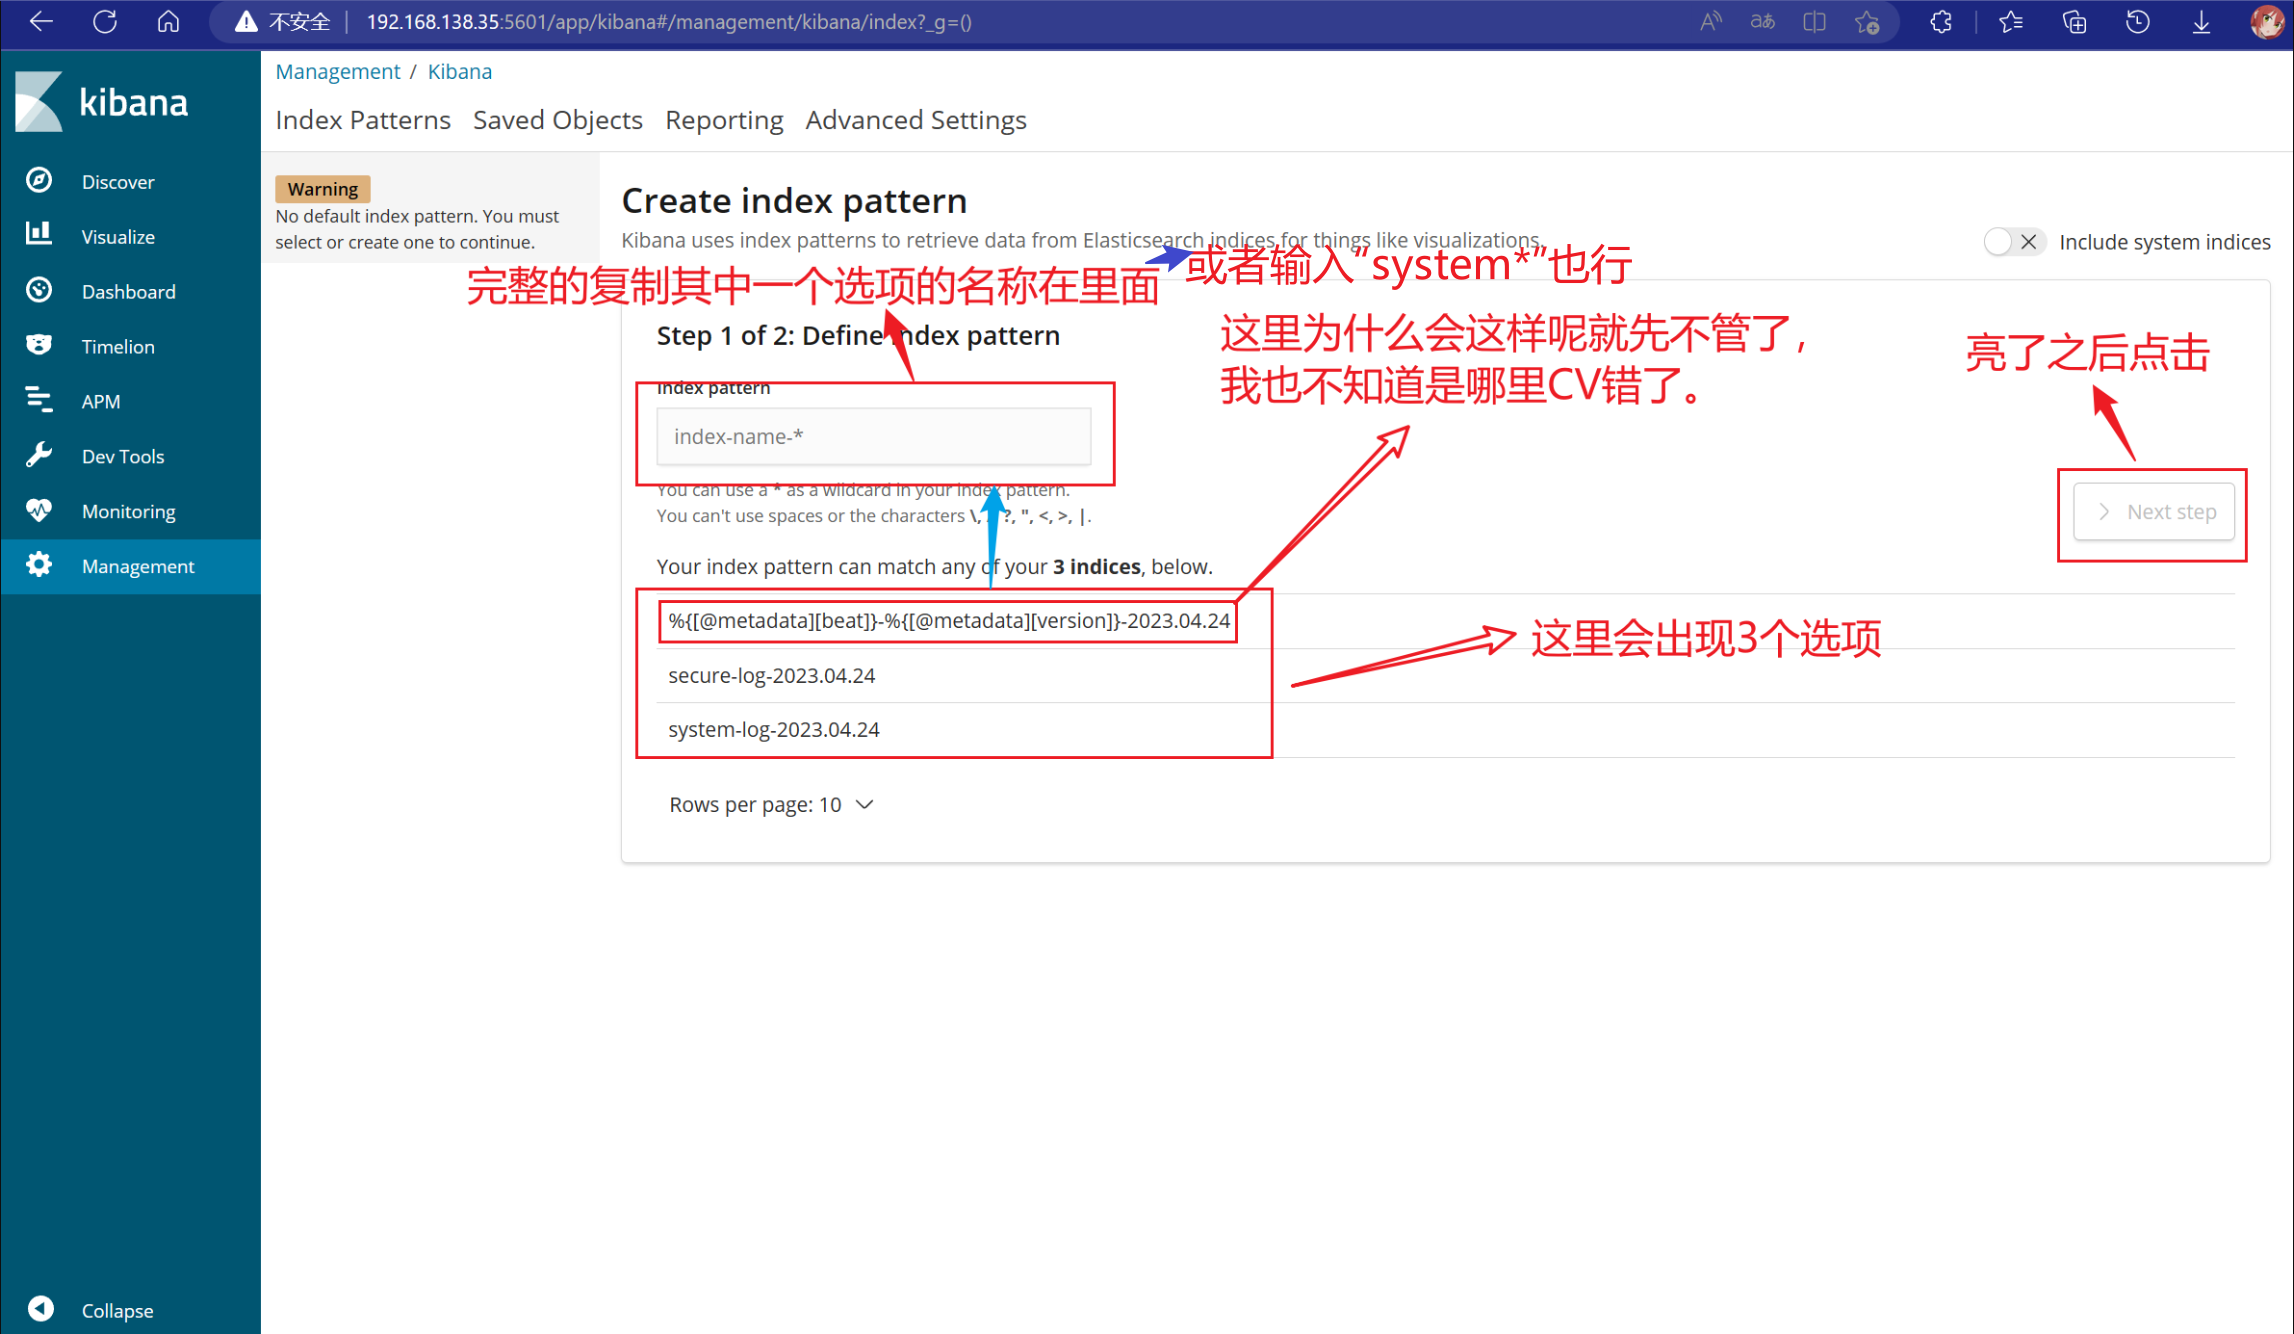
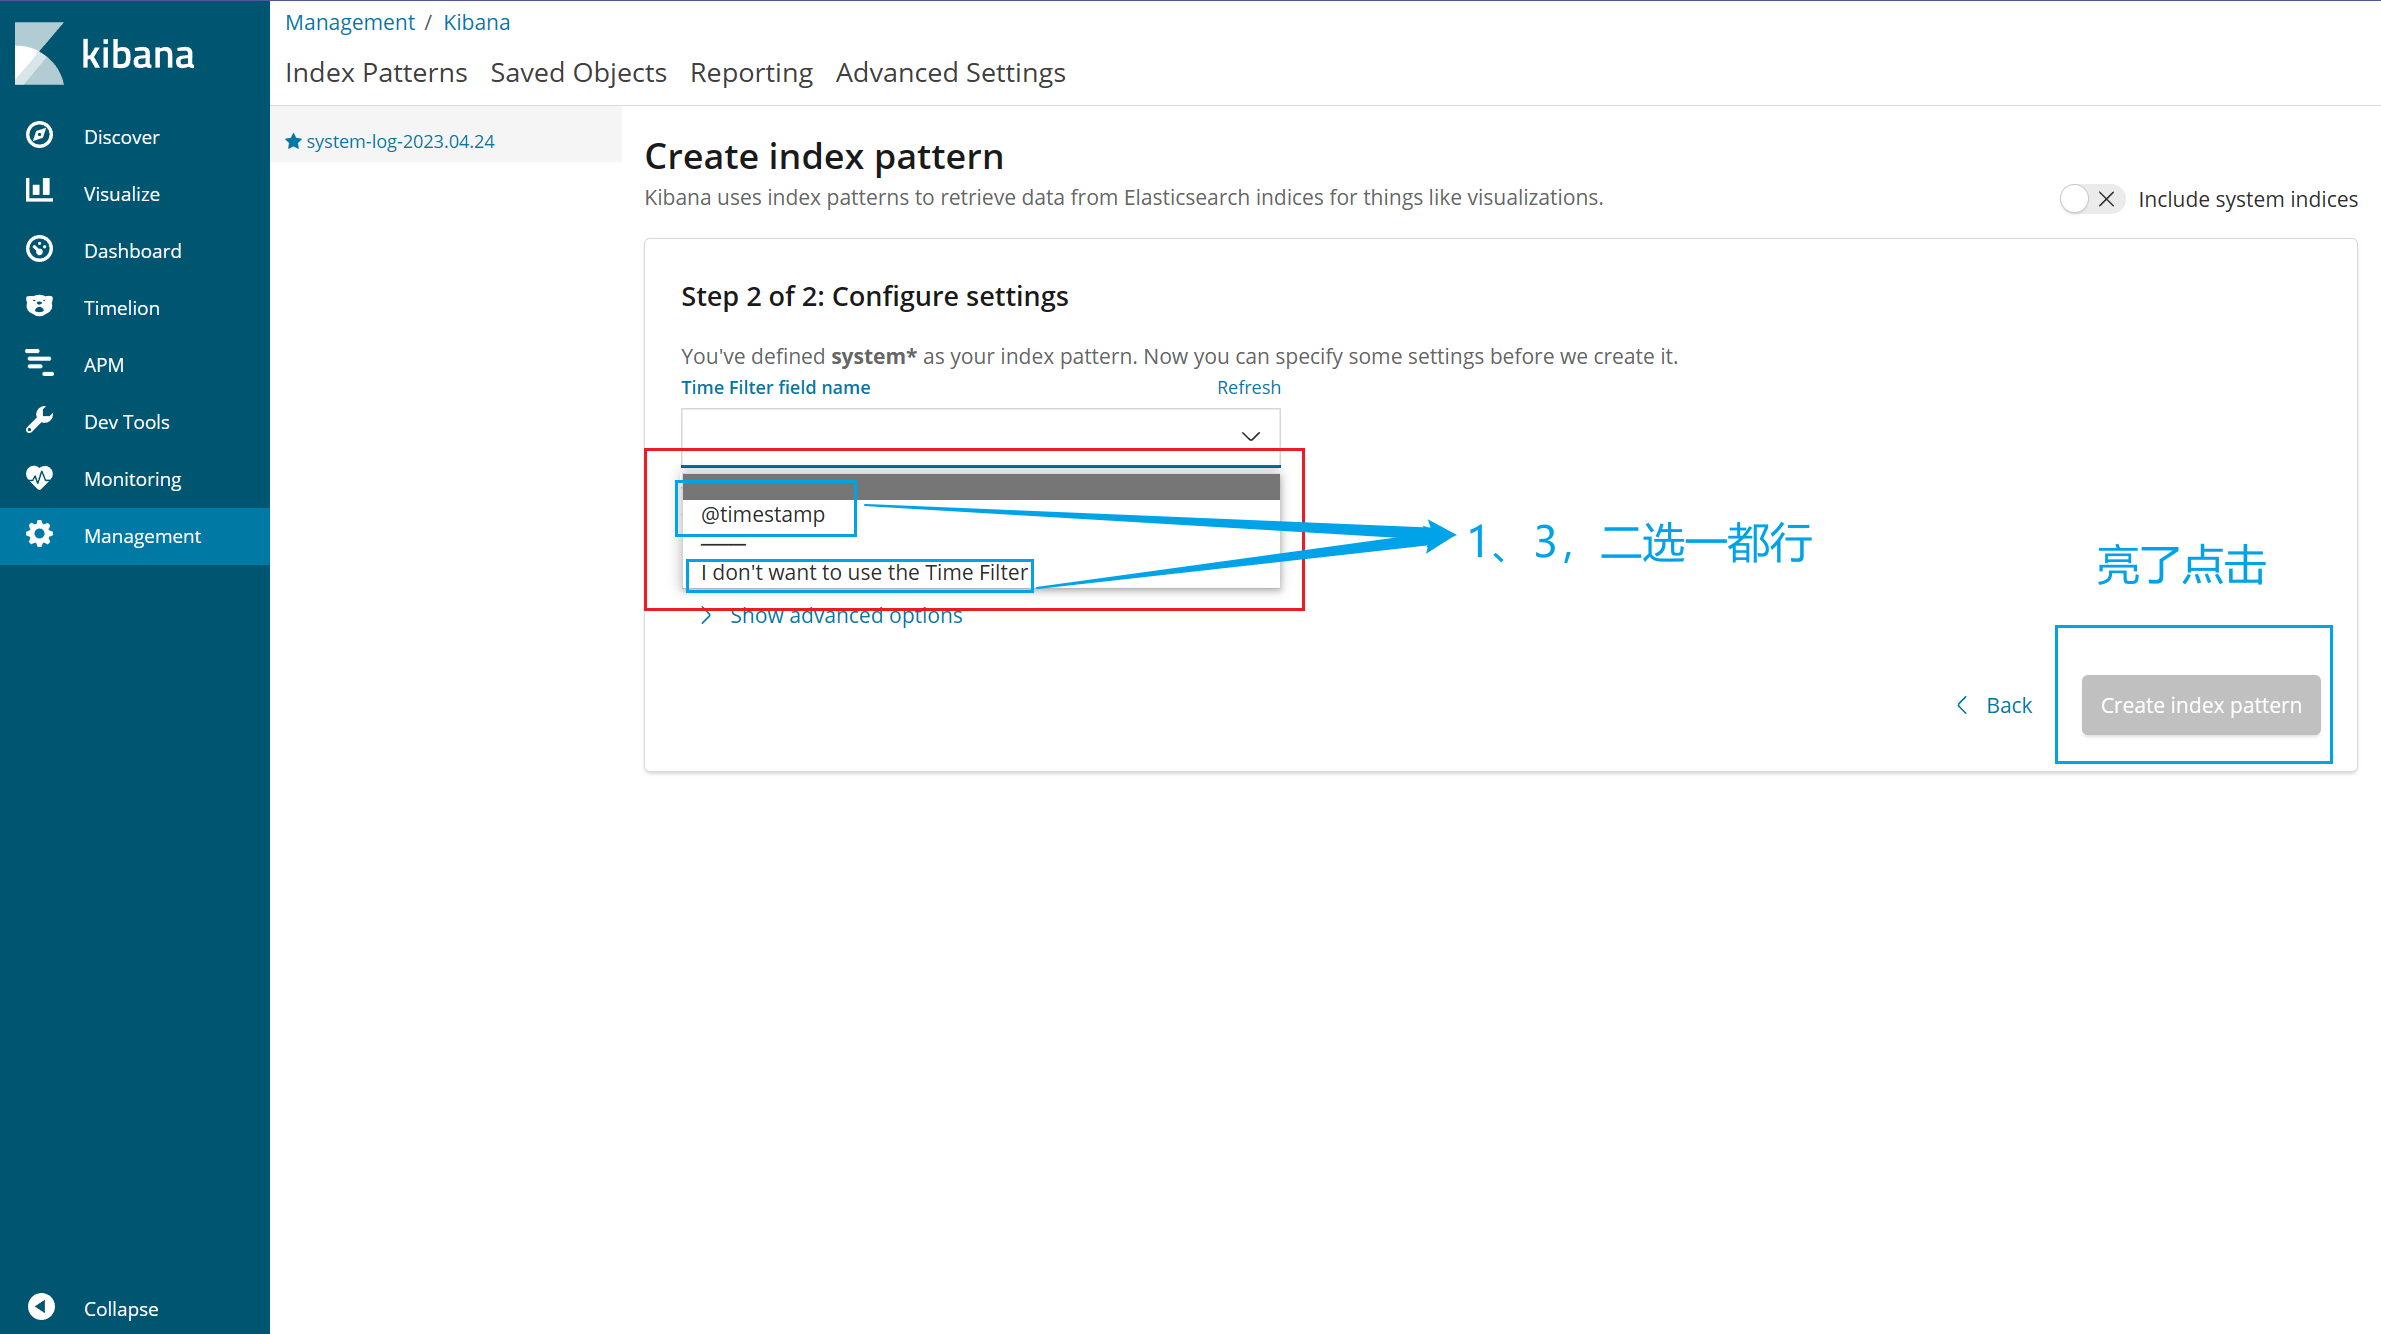
9.5使用
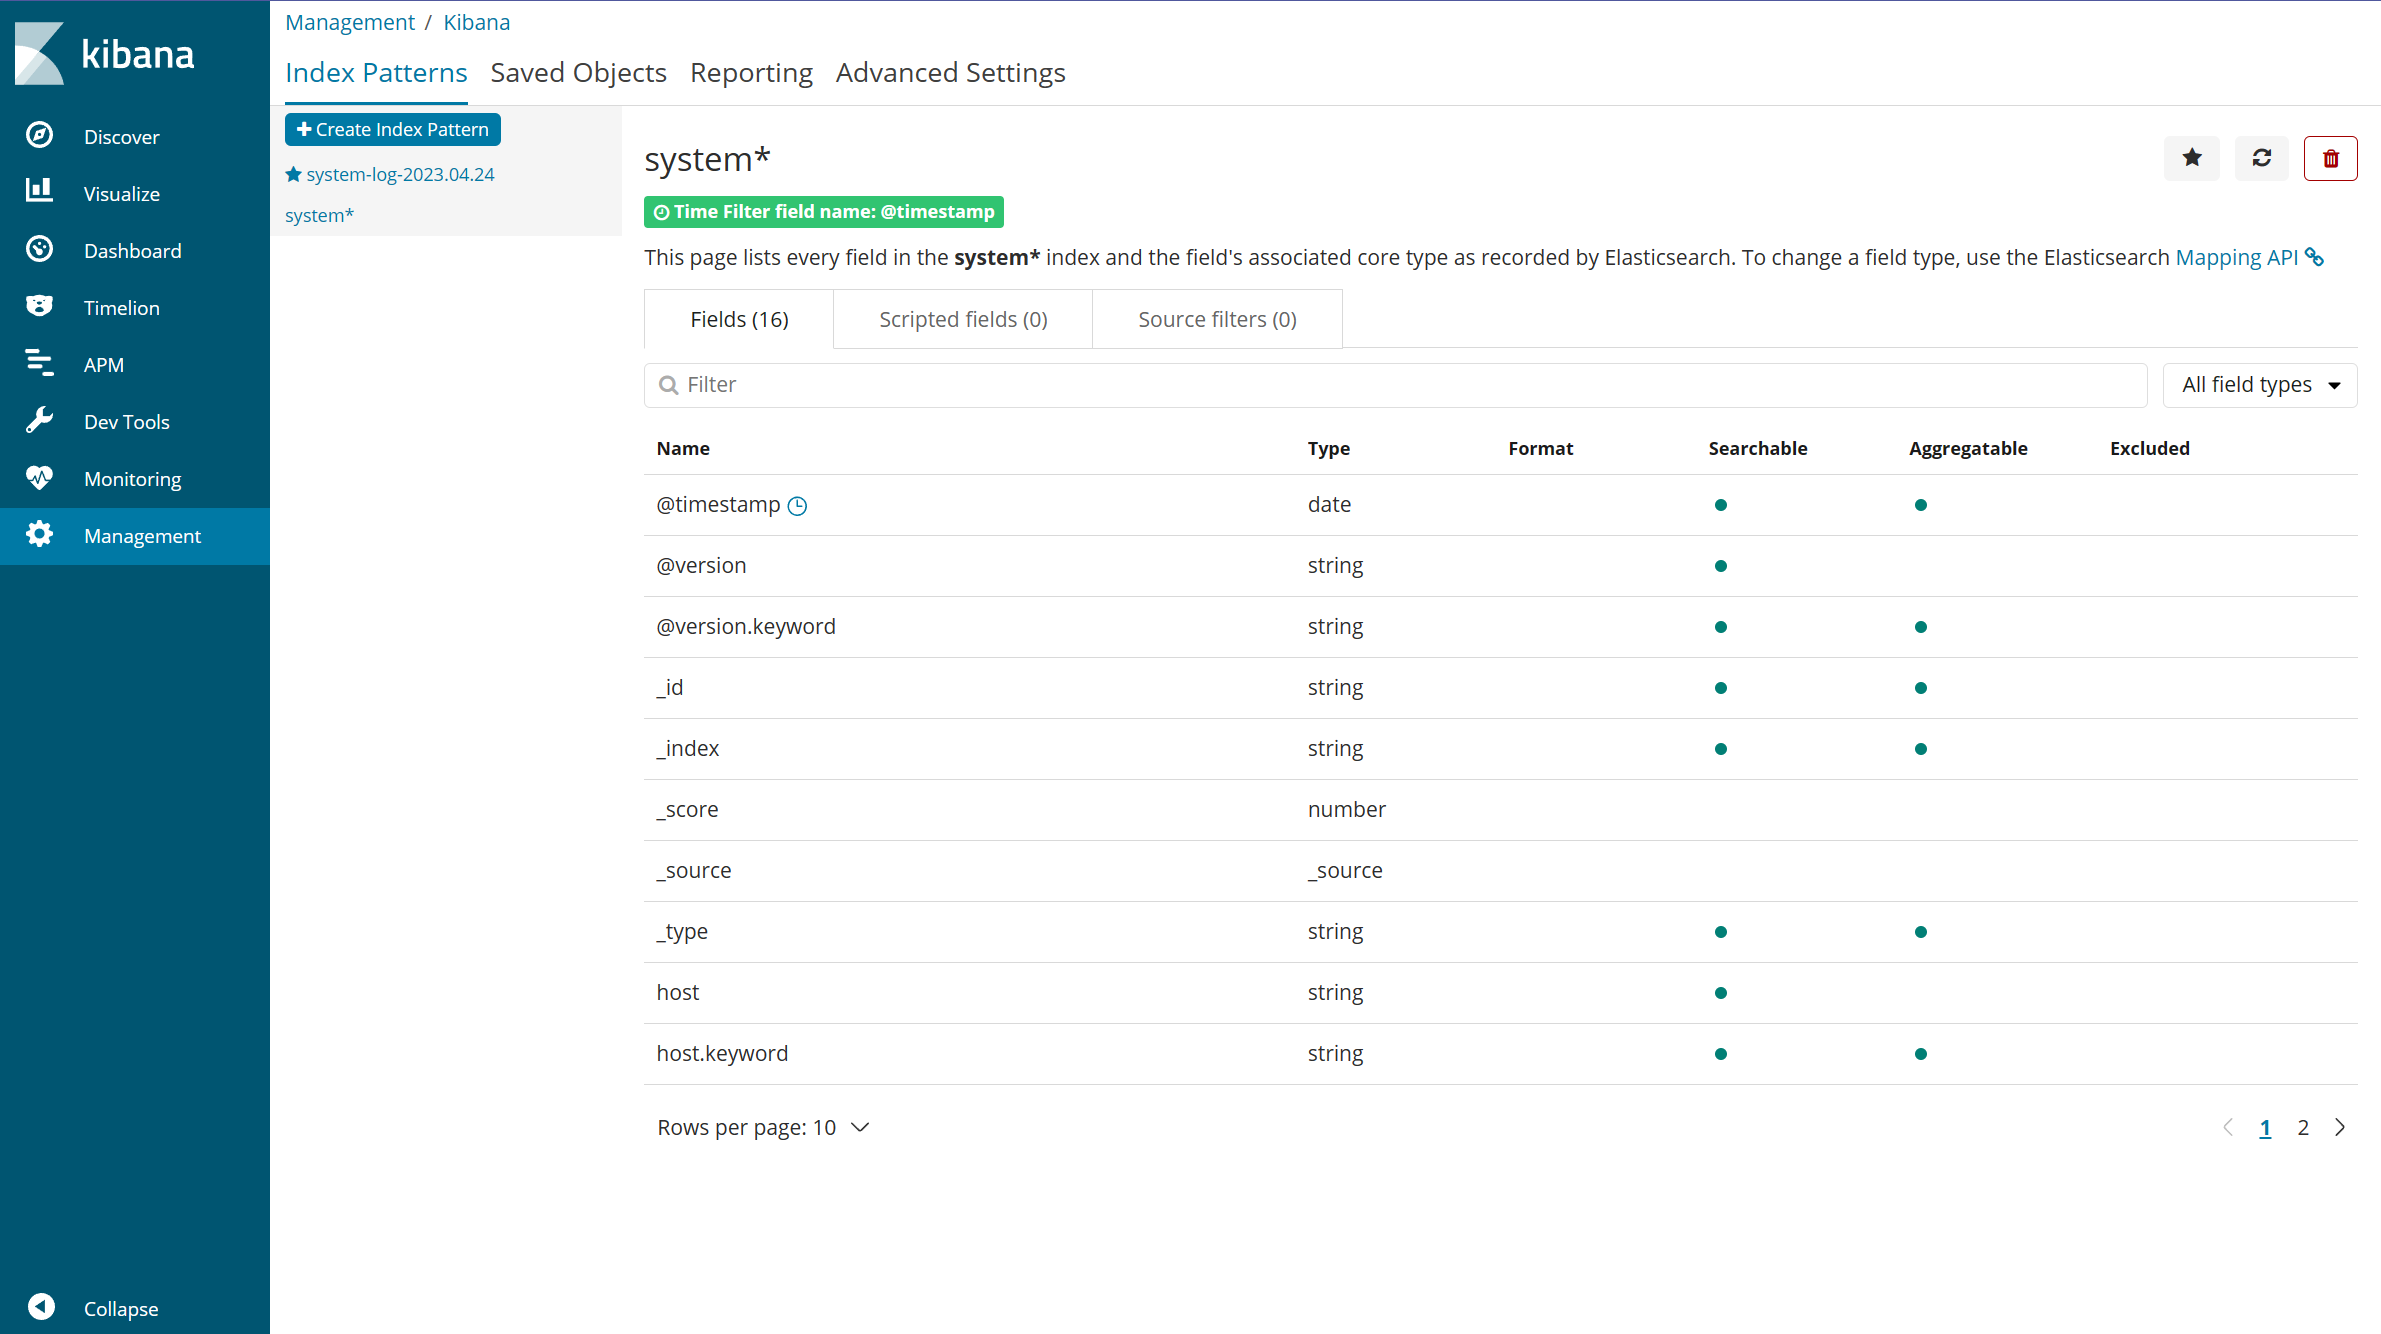
按下图所示进行:
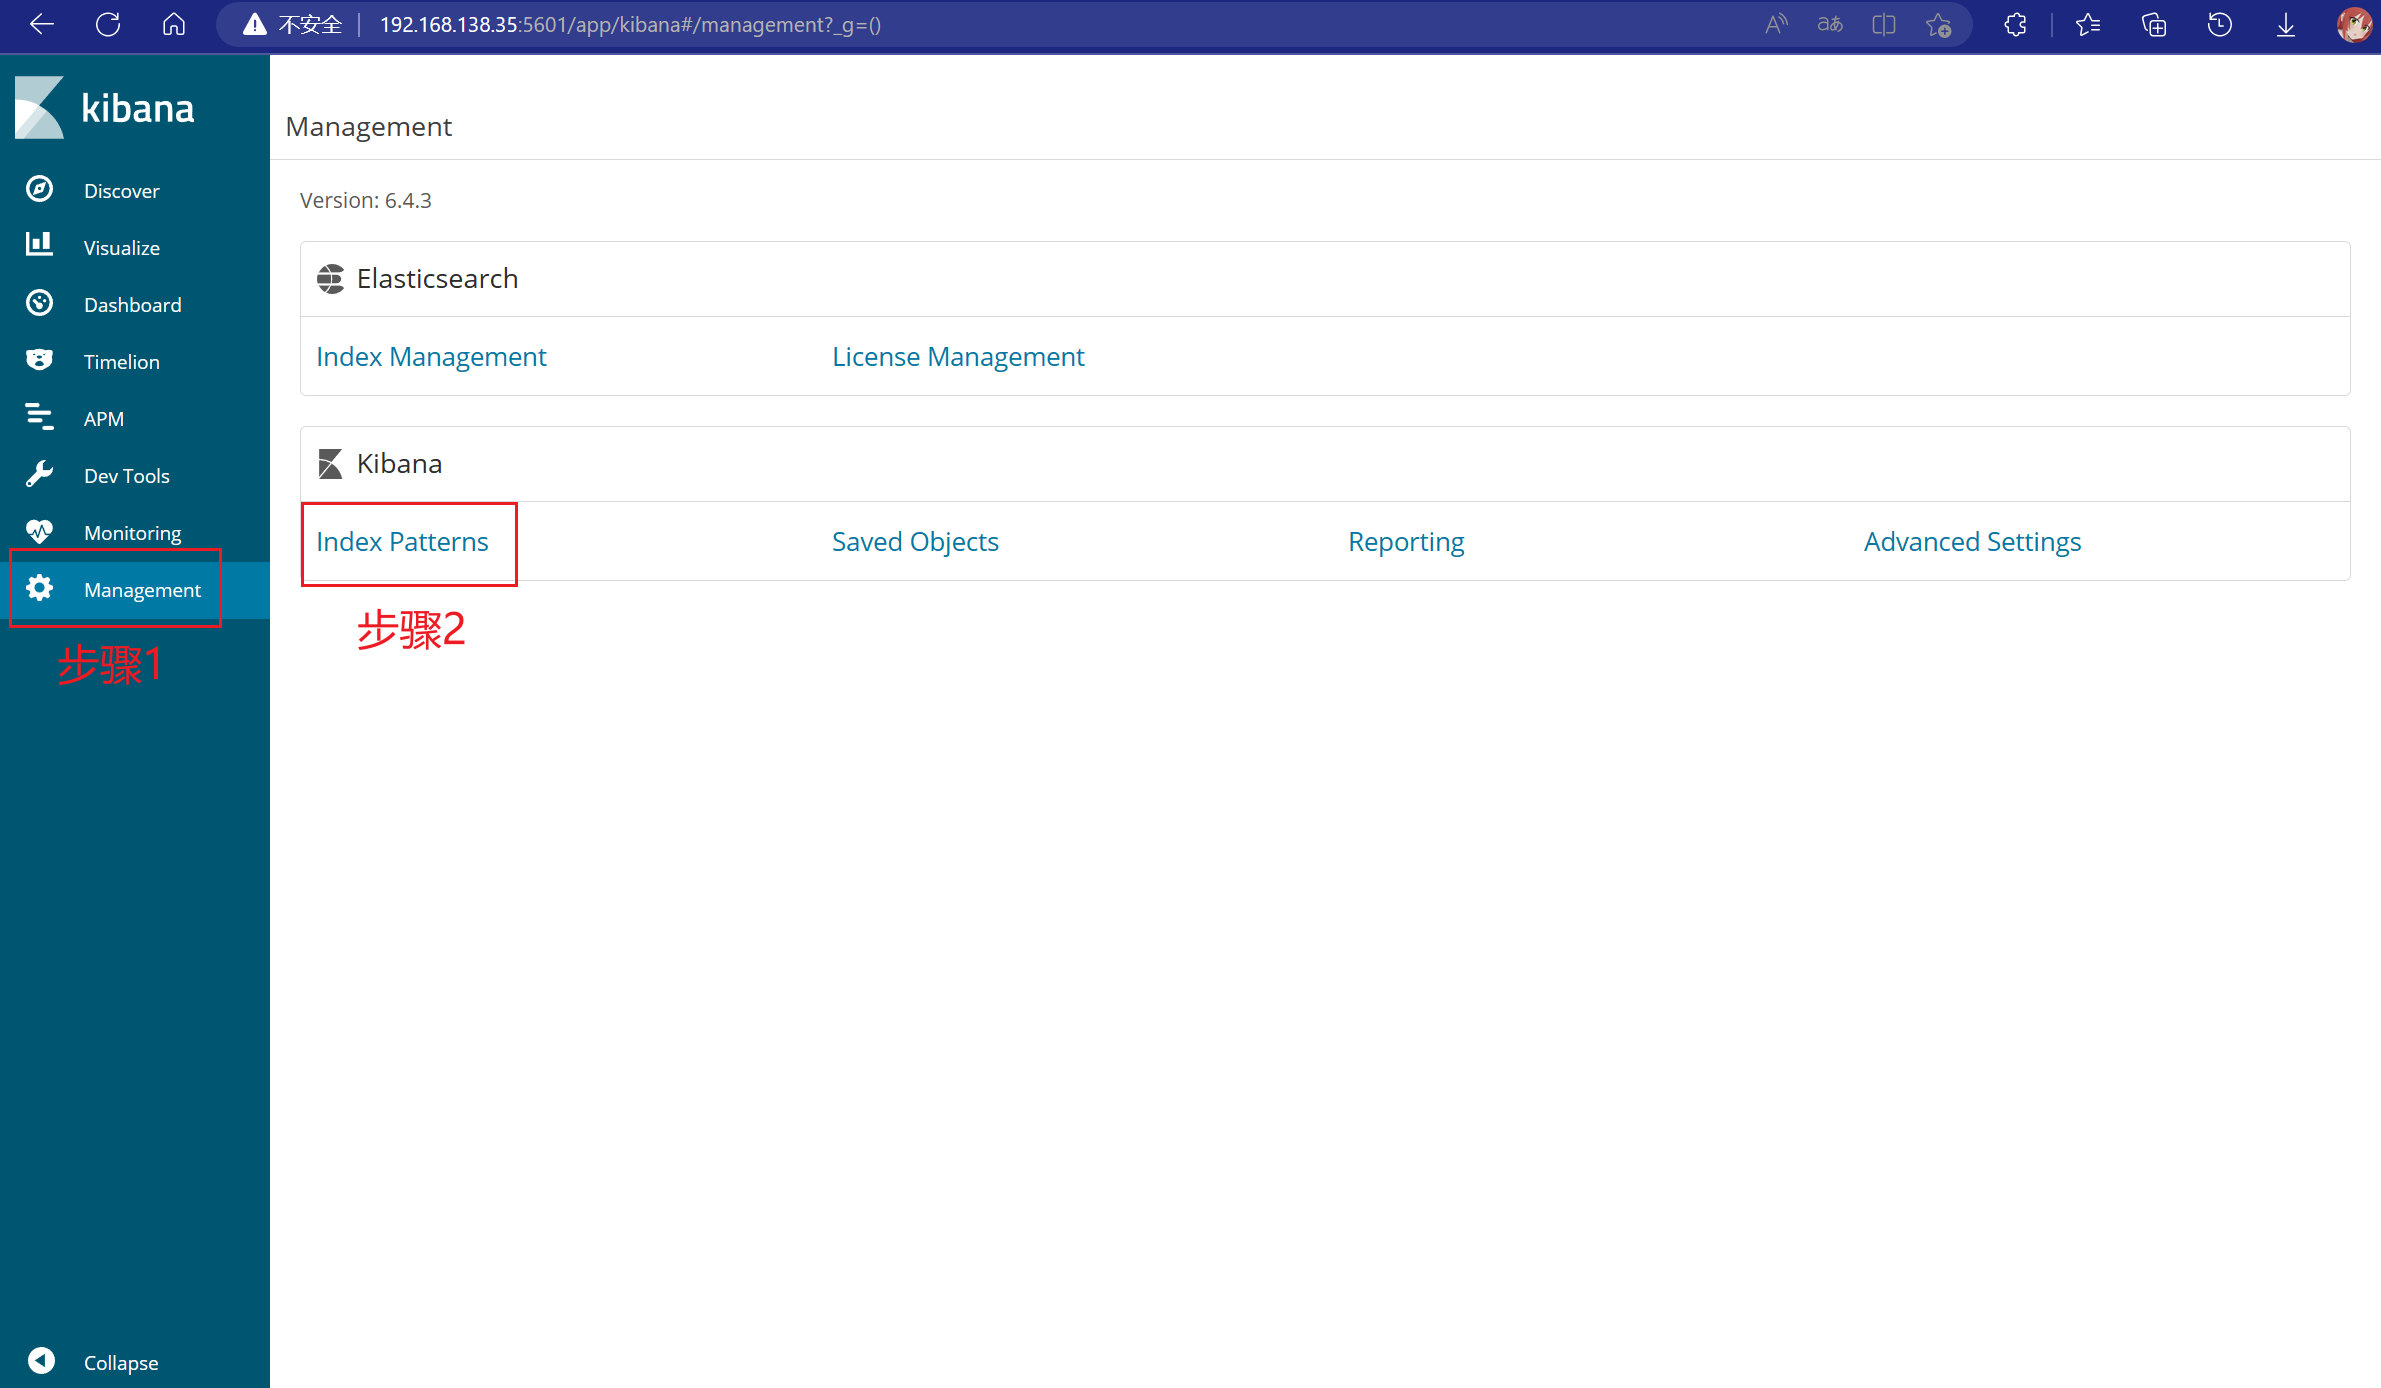
创建成功