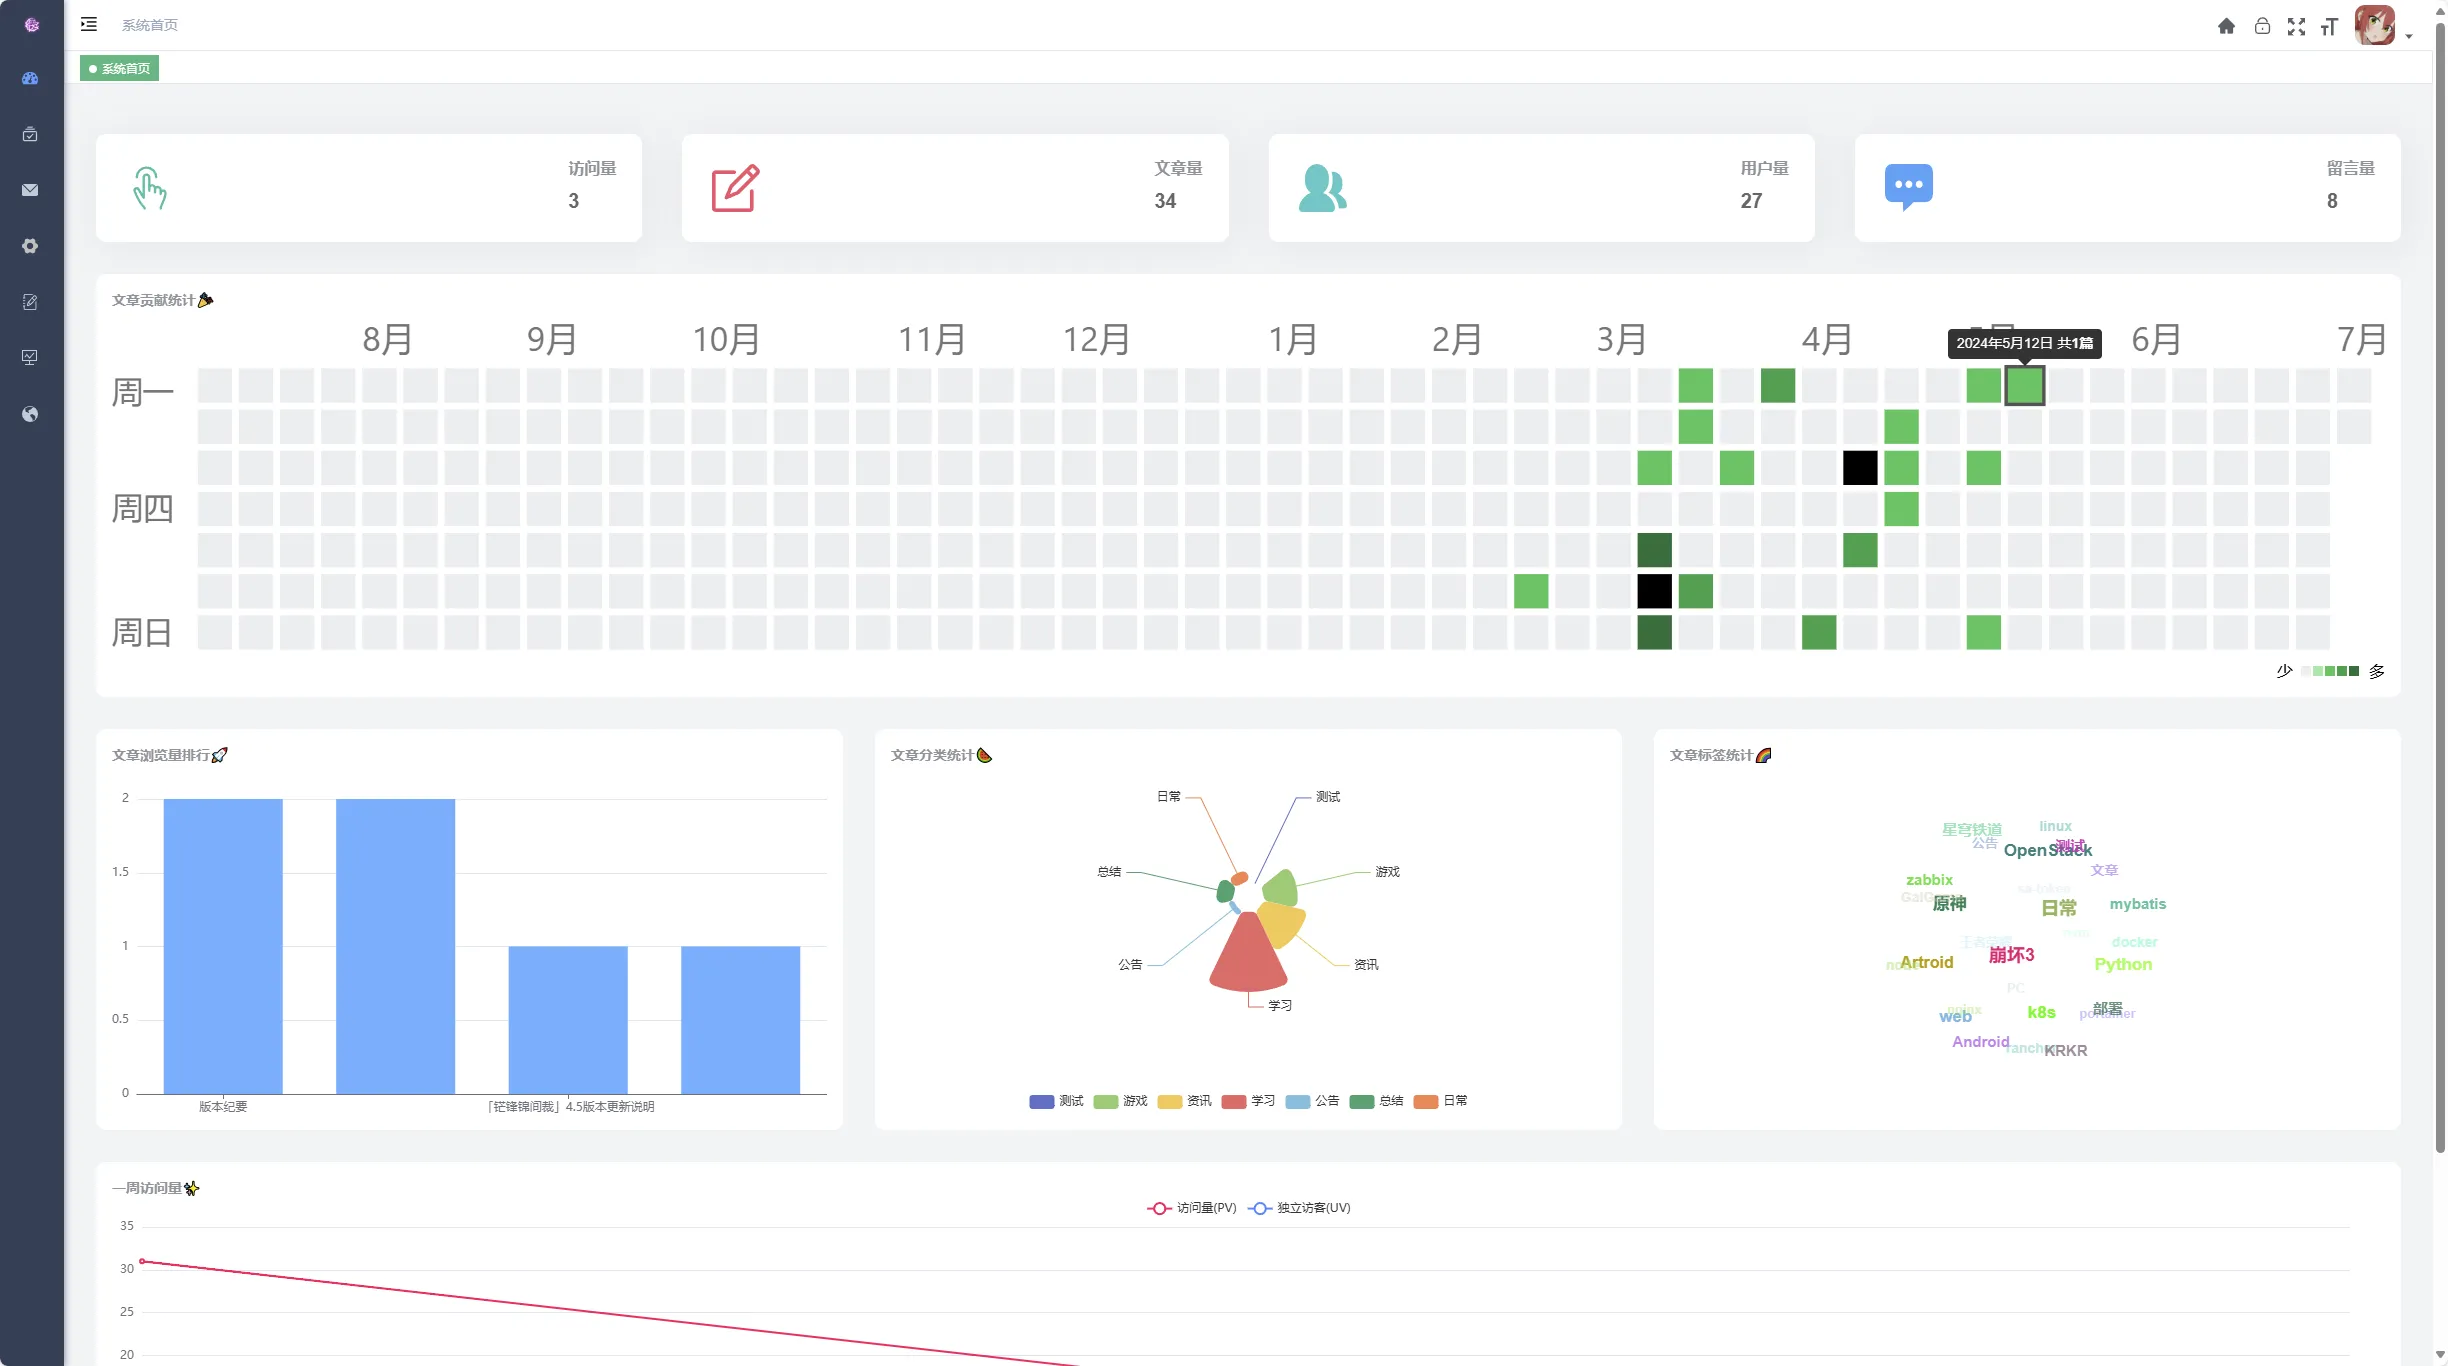
<template>
  <div class="dashboard-container">
    <github-corner class="github-corner" />
    <el-row :gutter="40" class="panel-group">
      <el-col :xs="12" :sm="12" :lg="6" class="card-panel-col">
        <div class="card-panel">
          <div class="card-panel-icon-wrapper icon-view">
            <svg-icon icon-class="button" size="4em" class-tagName="card-panel-icon" />
          </div>
          <div class="card-panel-description">
            <div class="card-panel-text">
              访问量
            </div>
            <span class="card-panel-num">{{ viewCount }}</span>
          </div>
        </div>
      </el-col>
      <el-col :xs="12" :sm="12" :lg="6" class="card-panel-col">
        <div class="card-panel">
          <div class="card-panel-icon-wrapper icon-money">
            <svg-icon icon-class="edit" size="3rem" class-tagName="card-panel-icon" />
          </div>
          <div class="card-panel-description">
            <div class="card-panel-text">
              文章量
            </div>
            <span class="card-panel-num">{{ articleCount }}</span>
          </div>
        </div>
      </el-col>
      <el-col :xs="12" :sm="12" :lg="6" class="card-panel-col">
        <div class="card-panel">
          <div class="card-panel-icon-wrapper icon-people">
            <svg-icon icon-class="peoples" size="4em" lass-tagName="card-panel-icon" />
          </div>
          <div class="card-panel-description">
            <div class="card-panel-text">
              用户量
            </div>
            <span class="card-panel-num">{{ userCount }}</span>
          </div>
        </div>
      </el-col>
      <el-col :xs="12" :sm="12" :lg="6" class="card-panel-col">
        <div class="card-panel">
          <div class="card-panel-icon-wrapper icon-message">
            <svg-icon icon-class="comment" size="4em" class-tagName="card-panel-icon" />
          </div>
          <div class="card-panel-description">
            <div class="card-panel-text">
              留言量
            </div>
            <span class="card-panel-num">{{ messageCount }}</span>
          </div>
        </div>
      </el-col>
    </el-row>
    <el-row class="data-card" style="margin-bottom:32px;">
      <div class="title">文章贡献统计🎉</div>
      <calendar-heatmap style=" width: 100%; margin-top: 0.5rem" :values="articleStatisticsList" :end-date="new Date()"
        :range-color="['#ebedf0', '#9be9a8', '#40c463', '#30a14e', '#216e39']" />
    </el-row>
    <el-row :gutter="32">
      <el-col :xs="24" :sm="24" :lg="8">
        <div class="chart-wrapper">
          <div class="title">文章浏览量排行🚀</div>
          <Echarts :options="articleRank" height="350px"></Echarts>
        </div>
      </el-col>
      <el-col :xs="24" :sm="24" :lg="8">
        <div class="chart-wrapper">
          <div class="title">文章分类统计🍉</div>
          <Echarts :options="category" height="350px"></Echarts>
        </div>
      </el-col>
      <el-col :xs="24" :sm="24" :lg="8">
        <div class="chart-wrapper">
          <div class="title">文章标签统计🌈</div>
          <TagCloud v-if="tagLoad" :tag-list="tagList"></TagCloud>
        </div>
      </el-col>
    </el-row>
    <el-row class="data-card">
      <div class="title">一周访问量✨</div>
      <Echarts :options="userView" height="350px"></Echarts>
    </el-row>
  </div>
</template>

<script setup lang="ts">
import { TagVO } from "@/api/article/types";
import { getBlogInfo } from "@/api/blog";
import { ArticleStatisticsVO } from "@/api/blog/types";
import GithubCorner from "@/components/GithubCorner/index.vue";
import TagCloud from "@/components/TagCloud/index.vue";
import { onMounted, reactive, ref } from "vue";
const tagList = ref<TagVO[]>([]);
const viewCount = ref(0);
const messageCount = ref(0);
const userCount = ref(0);
const tagLoad = ref(false);
const articleCount = ref(0);
const articleStatisticsList = ref<ArticleStatisticsVO[]>([]);
let userView = reactive({
  xAxis: {
    data: [] as string[],
    boundaryGap: false,
    axisTick: {
      show: false
    }
  },
  grid: {
    left: 8,
    right: 35,
    bottom: 0,
    top: 30,
    containLabel: true
  },
  tooltip: {
    trigger: 'axis',
    axisPointer: {
      type: 'cross'
    },
    padding: [5, 10]
  },
  yAxis: {
    axisTick: {
      show: false
    }
  },
  legend: {
    data: ['访问量(PV)', '独立访客(UV)']
  },
  series: [
    {
      name: '访问量(PV)',
      itemStyle: {
        color: '#FF005A'
      },
      lineStyle: {
        color: '#FF005A',
        width: 2
      },
      smooth: true,
      type: 'line',
      data: [

      ] as number[],
      animationDuration: 2800,
      animationEasing: 'cubicInOut'
    },
    {
      name: '独立访客(UV)',
      smooth: true,
      type: 'line',
      itemStyle: {
        color: '#3888fa'
      },
      lineStyle: {
        color: '#3888fa',
        width: 2
      },
      areaStyle: {
        color: '#f3f8ff'
      },
      data: [

      ] as number[],
      animationDuration: 2800,
      animationEasing: 'quadraticOut'
    }
  ]
});
let category = reactive({
  tooltip: {
    trigger: 'item',
    formatter: '{a} <br/>{b} : {c} ({d}%)'
  },
  legend: {
    top: "bottom",
  },
  series: [
    {
      name: '分类统计',
      type: 'pie',
      radius: [15, 95],
      center: ['50%', '38%'],
      roseType: 'area',
      itemStyle: {
        borderRadius: 6
      },
      data: [] as {
        value: number;
        name: string;
      }[],
    }
  ]
});
let articleRank = reactive({
  tooltip: {
    trigger: 'axis',
    axisPointer: {
      type: 'shadow'
    }
  },
  color: ['#58AFFF'],
  grid: {
    left: '0%',
    right: '0%',
    bottom: '0%',
    top: '10%',
    containLabel: true
  },
  xAxis: {
    data: [] as string[],
    axisTick: {
      alignWithLabel: true
    }
  },
  yAxis: {
    type: 'value',
    axisTick: {
      show: false
    }
  },
  series: [
    {
      name: '浏览量',
      type: 'bar',
      data: [] as number[]
    }
  ]
});
const getList = () => {
  getBlogInfo().then(({ data }) => {
    viewCount.value = data.data.viewCount;
    messageCount.value = data.data.messageCount;
    userCount.value = data.data.userCount;
    articleCount.value = data.data.articleCount;
    articleStatisticsList.value = data.data.articleStatisticsList;
    if (data.data.tagVOList != null) {
      tagList.value = data.data.tagVOList;
      tagLoad.value = true;
    }
    if (data.data.articleRankVOList != null) {
      data.data.articleRankVOList.forEach((item) => {
        articleRank.series[0].data.push(item.viewCount);
        articleRank.xAxis.data.push(item.articleTitle);
      });
    }
    if (data.data.categoryVOList != null) {
      data.data.categoryVOList.forEach((item) => {
        category.series[0].data.push({
          value: item.articleCount,
          name: item.categoryName,
        });
      });
    }
    if (data.data.userViewVOList != null) {
      data.data.userViewVOList.forEach((item) => {
        userView.xAxis.data.push(item.date);
        userView.series[0].data.push(item.pv);
        userView.series[1].data.push(item.uv);
      });
    }
  })
};
onMounted(() => {
  getList();
})
</script>
